Product design · BorderPulse
Designing for a decision when the data is imperfect
BorderPulse shows how lane choice, missing reports, freshness and historical context shape a useful data interface.
DIGITO ·
A border wait report gives you a number. Choosing a crossing takes more: the lane you can use, whether it is open, how old the report is and how far you would have to drive. A clean interface can make that distinction easier to understand. It can also hide it.
BorderPulse, an independent product designed and built by DIGITO, brings northbound U.S.–Mexico crossing reports into a dashboard, local comparisons and historical planning views. The useful design lesson is in the conditions around the number. What has to be true before a reported wait becomes a useful option?
Start with the decision you can actually support
“Which crossing has the shortest reported wait?” is a narrower question than “Which route will get me there first?” The second includes driving time, destination and the lanes a traveler is eligible to use. A product built around wait reports should be careful about answering a question its data cannot settle.
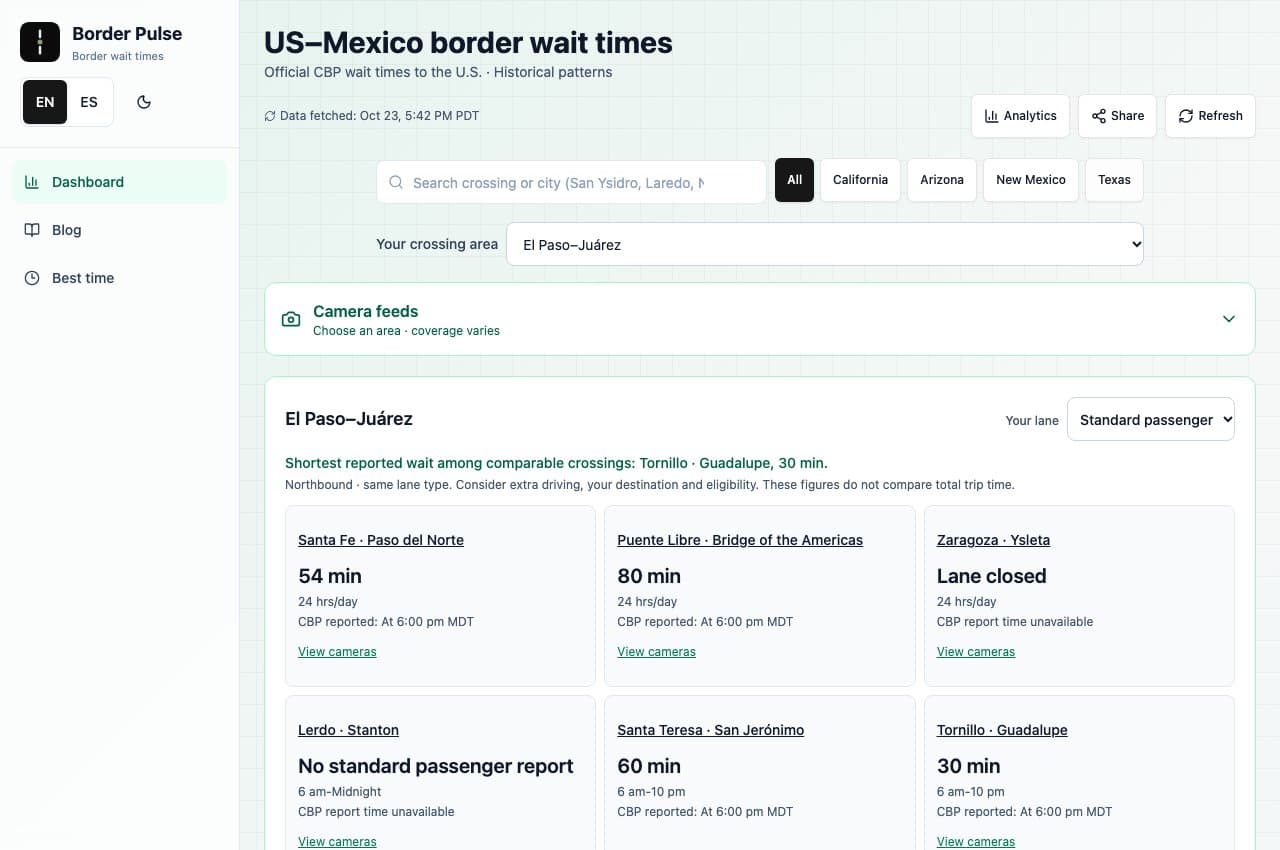
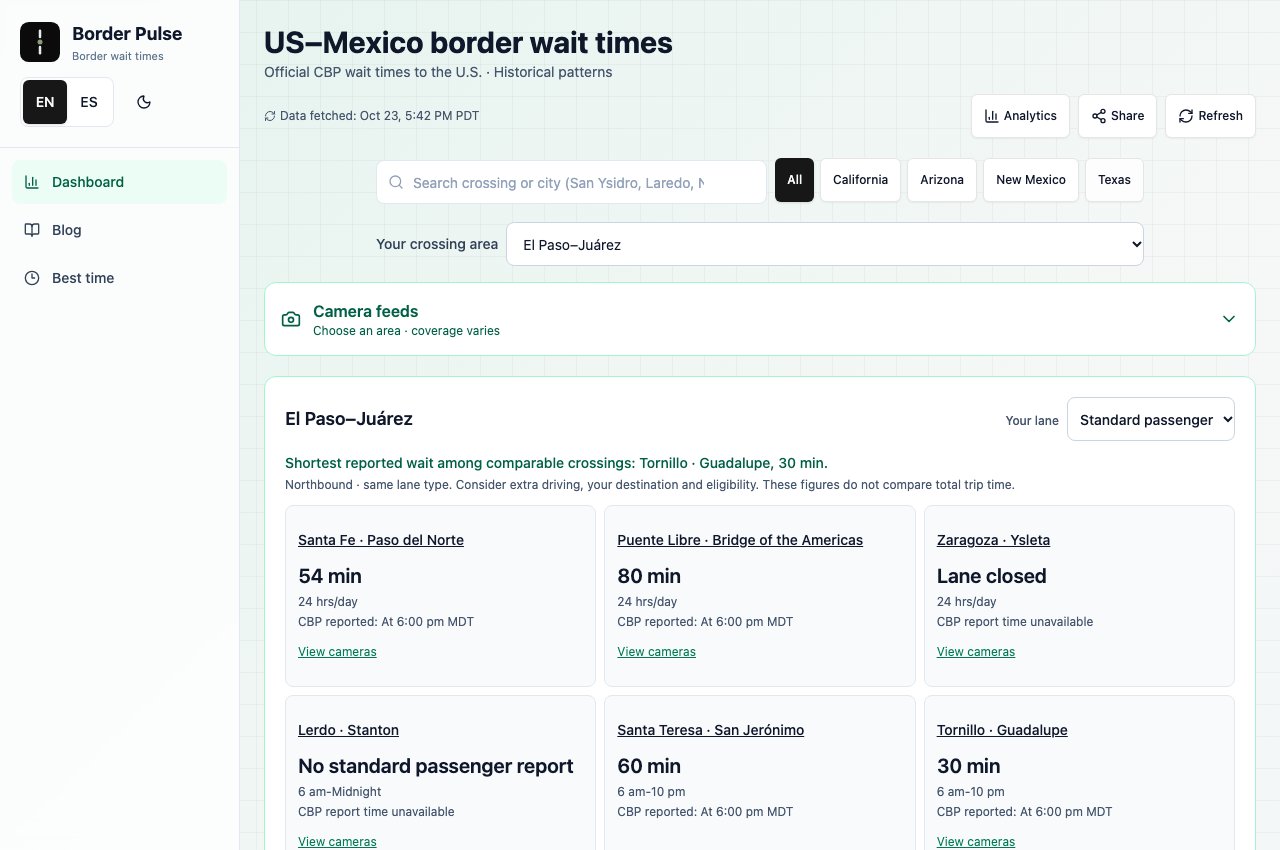
The El Paso–Juárez comparison makes its scope visible. Travelers choose a lane type and see nearby crossings together. The summary identifies a shortest reported wait among comparable crossings. The adjacent explanation reminds them to consider additional driving, destination and eligibility.
That wording matters. A precise label lets the interface offer useful help without quietly claiming to optimize the entire trip. For other data products, the same discipline begins with a simple question: what does this recommendation include, and what still belongs to the person making the decision?
Keep missing information separate from a good result
In the recorded comparison, a reported wait, a closed lane and a missing report appear as different states. They need different meanings. No report does not establish that a queue is empty. A closed lane cannot become a viable option because a numeric value happens to be absent.
The case describes a comparison rule that excludes closed crossings, uncertain hours and missing reports from the shortest-wait answer. This is product judgment expressed through data rules, then made visible in the interface.
It also gives teams a practical review method. Before polishing a dashboard, inspect every empty state. Does a blank value mean zero, unknown, unavailable or not applicable? If those states collapse into one display, the visual design may be asking people to make a decision from a false equivalence.
Put freshness where it changes the interpretation
The time a page fetches data and the time a source reports a lane are different facts. BorderPulse’s public snapshot explicitly distinguishes them. Its crossing rows carry report clocks, while the page explains that individual reports can predate the published snapshot. View the public snapshot.
For a traveler, that distinction belongs near the information they are comparing. A fresh-looking page can still contain an older observation. Moving every qualification to a footer would make the layout cleaner at the cost of making the number easier to misread.
The design principle is practical: keep the context that could change a decision close to the decision. Use longer methodology pages for the calculation and collection details, while keeping essential limitations in the working view.
Give history a bounded job
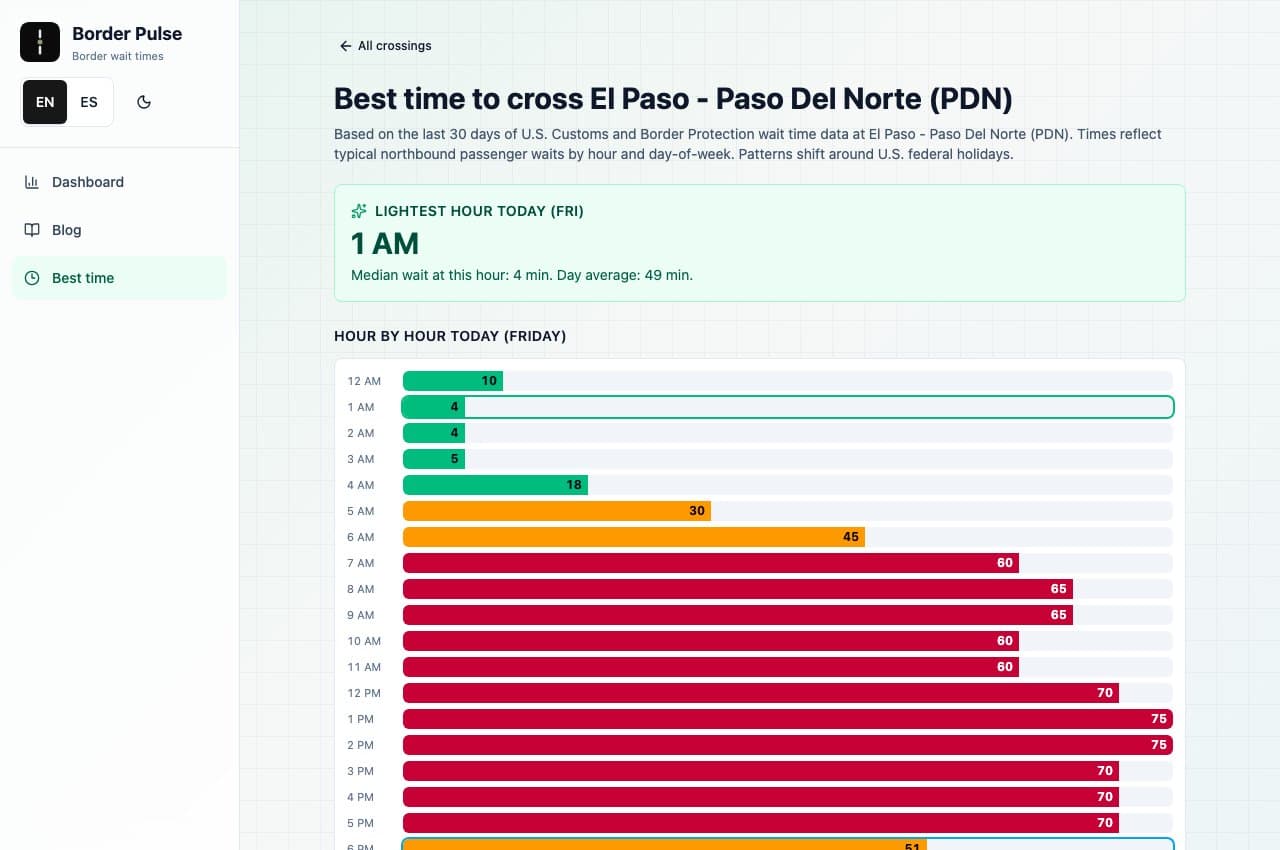
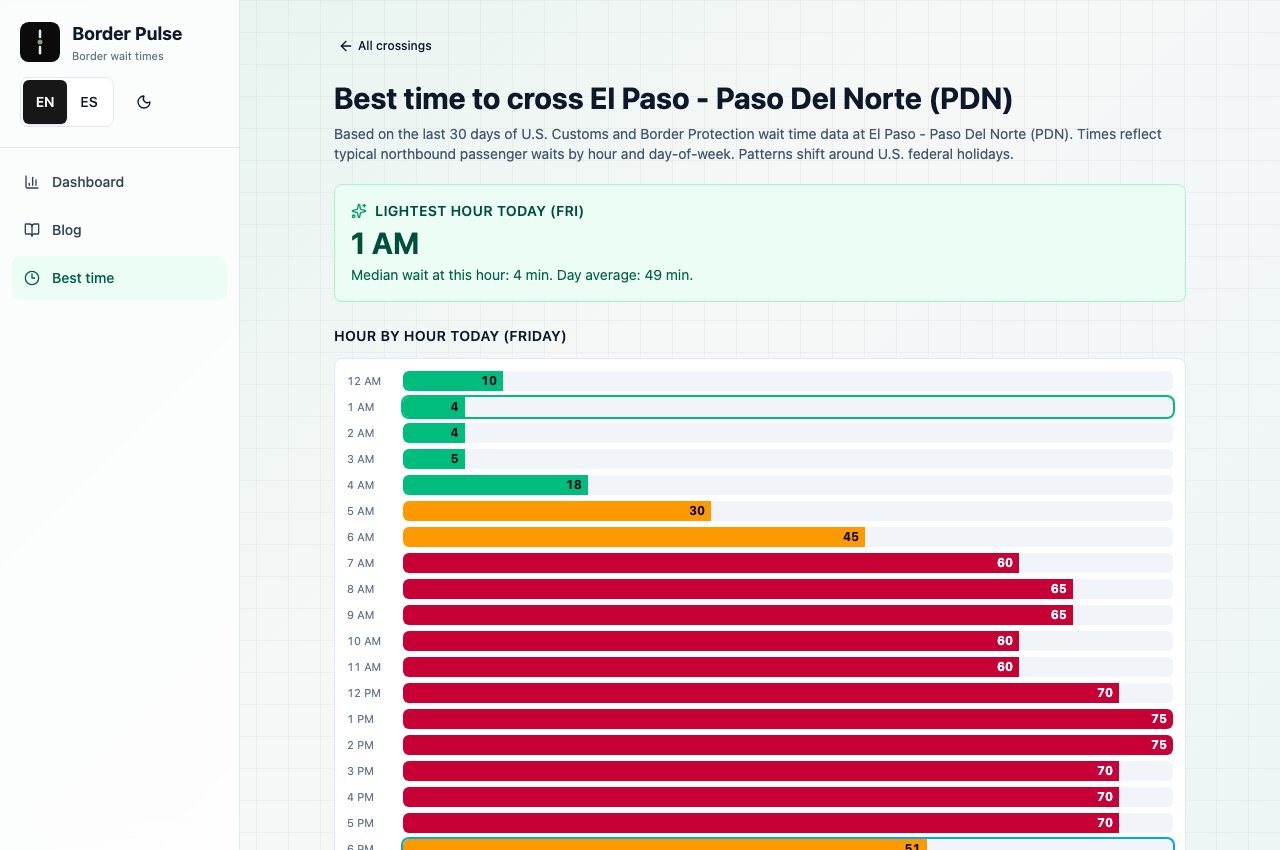
The Paso del Norte planning screen shows hourly patterns from stored CBP reports. The case explains a 30-day window, medians, sample coverage and operating-hour constraints. This offers a way to inspect typical conditions before returning to a current report.
A historical pattern and a forecast make different promises. A low historical median does not guarantee the same wait on a future trip. The distinction should survive the chart title, surrounding copy and any screenshot shared outside the product.
The recorded screen uses labeled hours and numeric values alongside colored bars. Those details make the pattern available through more than color alone. The question for a chart review becomes: can someone understand what varies, over which period, and with what limits?
Review understanding before claiming impact
These screens demonstrate implemented product choices. They do not, by themselves, establish shorter trips, higher conversion or revenue growth. Those outcomes would require separate evidence.
A useful next evaluation would ask travelers to compare two crossings and explain their choice. Do they notice the lane type and report time? Can they distinguish an unavailable report from a short wait? Do they understand why the lowest number might not produce the shortest trip? These are proposed checks, not results we claim to have measured.
For a product team, the starting point is a decision, the evidence available to support it and the uncertainty that remains. BorderPulse shows how those constraints can shape the interface itself. The complete case includes the actual screens and the product links, so the reasoning can be inspected alongside the work.
Evidence reviewed October 24, 2026 (UTC): the recorded screens, DIGITO’s case and the public BorderPulse snapshot. The historical-method explanation is attributed to the case; this article does not independently audit the methodology or claim measured user outcomes.